Manager Control and Dashboard
The CRM is valuable to a manager not because it stores data, but because it shows the real state of the work: where the money is in the process, what is stuck, who has no next step, and which commitments are overdue. This page explains how to maintain regular control and how to use the dashboard.
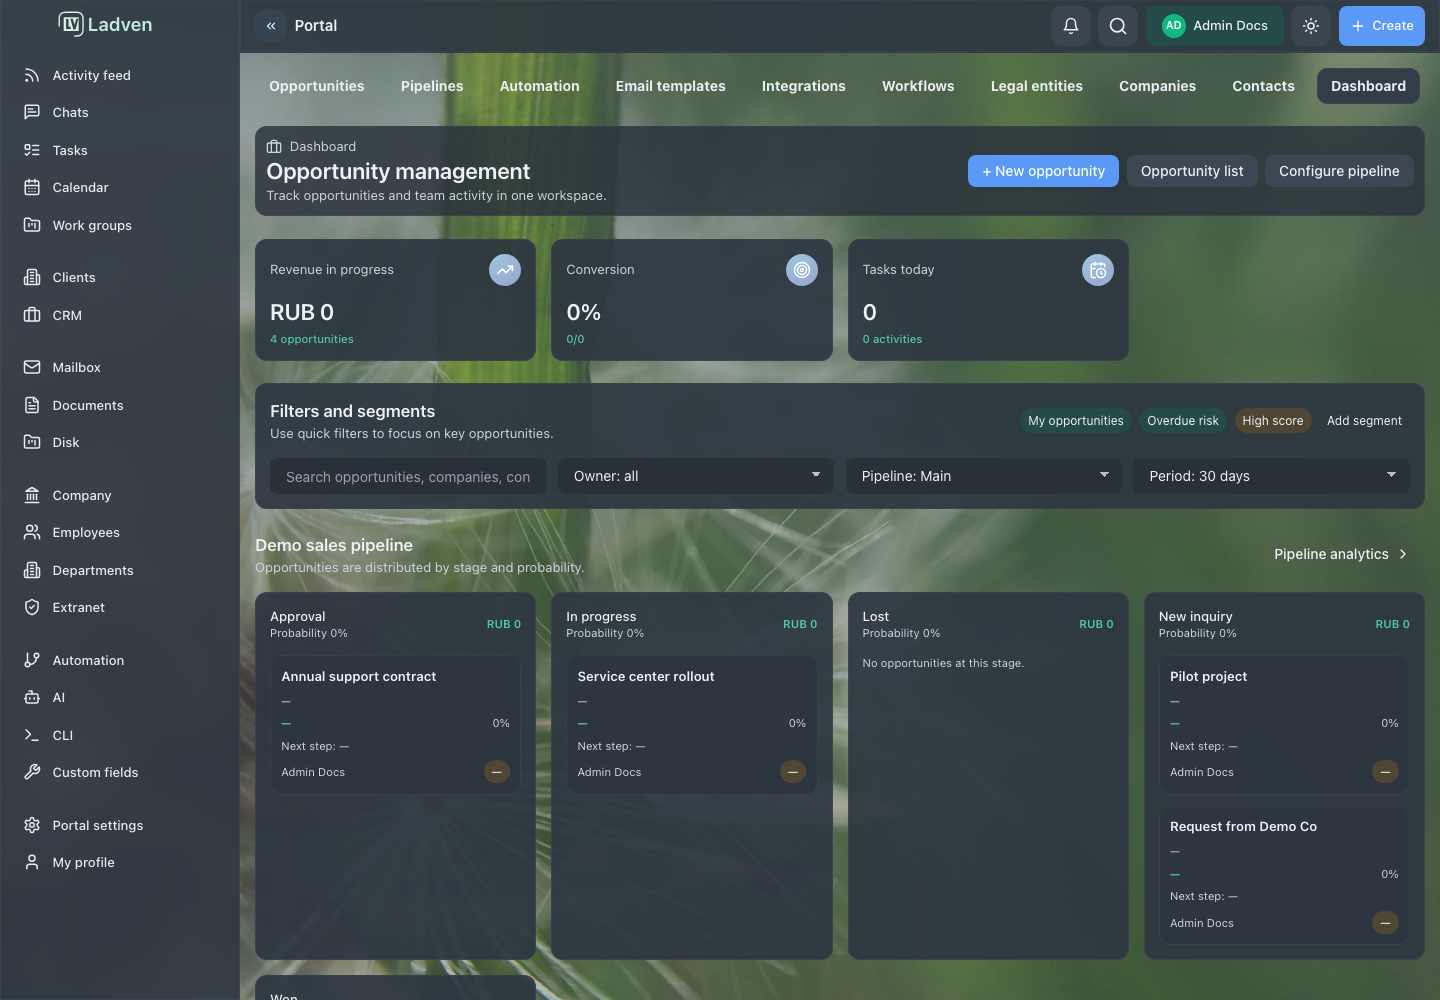
The CRM dashboard opens at /crm/dashboard. It is an overview screen for the owner and the department lead.
What the dashboard shows
The dashboard assembles a picture of the client process across several blocks:
- Key metrics: the total amount of deals in progress, conversion (the share of won deals among closed ones), and today's tasks and activities. This is a quick answer to the question "how are things going."
- Pipeline preview: the first pipeline stages with the amount per stage, the average probability, and a few deals — you can see where work is piling up.
- Quick actions: create a deal, add a contact, schedule a meeting, and other frequent operations.
- Today's activities: a list of activities with the subject, context, due date, and owner.
The dashboard is the entry point for control: it is a convenient place to start and then drill down into the deals board or the client workspace.
Regular control
The dashboard shows a snapshot, but real control is a regular review of the working questions. A manager should periodically check:
- deals with no next step — this is the first sign that the work is about to stall;
- stuck stages, where deals sit longer than usual;
- deals with no owner — in practice no one is responsible for them;
- overdue deals and client tasks;
- deals closed without a clear reason — data about the causes of losses is lost;
- automation rules that create extra work or noise.
The best tool for the first points is the attention filter on the deals board: it collects everything that needs a reaction (overdue, due today, upcoming, unread), and you can view it for the whole team or only for yourself. Start your control with it, not with scrolling through the entire board.
When the metrics diverge from reality
If the dashboard or the board stops reflecting reality, the problem is almost always in the process and the data, not in the report. First put the source data in order: update the stages, assign owners and next steps, and record the outcomes of closed deals. The report will become truthful automatically once the data becomes truthful.
Do not try to "tweak" the picture for the sake of a nice snapshot: the dashboard is useful exactly to the extent that you can trust it.
How to read the metrics correctly
Metrics are only useful if everyone reads them the same way. A few typical misreadings:
- Conversion is counted among closed deals, not all deals. It is the share of won deals among completed ones (won + lost), not among all deals in progress. Open deals are not yet part of the conversion.
- The amount "in progress" is not revenue. The amount of open deals shows the volume in the pipeline, not money that has already been received or is guaranteed to come in. For a forecast, account for probability and stage.
- Today's tasks are not the same as all overdue work. The "today" block shows what is scheduled for the day; look for overdue and forgotten items through the attention filter, not in this block.
- The pipeline preview is a snapshot, not a full list. It shows the first stages and a few deals; for the full picture, use the deals board.
Agree as a team on how each metric is read, otherwise the same chart will be understood differently and decisions will be made on different grounds.
States you may see
- no access to the CRM module — the dashboard is unavailable;
- the metrics and pipeline preview are loading;
- the pipeline has no stages or deals — the blocks are empty;
- there are no activities for today — the list is empty;
- part of the data is hidden by permissions.
The filter block on the dashboard currently shows demonstration values and does not perform actual filtering: it is a preview, not a working tool. For real snapshots, use the filters and the attention filter on the deals board. This is a known product limitation; localized dashboard screenshots are not published until it is refined.
Good practices
- Start control with the attention filter, not with scrolling through the entire board.
- Regularly check deals with no next step and no owner.
- Watch for stuck stages and overdue client work.
- Require an outcome and a reason for closed deals — this is the data for conclusions.
- Fix the process and the source data, not the report.
- Review automation rules that create noise.
Common mistakes
Treating the dashboard as full control. The snapshot shows a picture, but decisions are made when reviewing specific deals.
Waiting for the problem to surface on its own. Without regular review, overdue items and stuck deals are noticed too late.
Leaving deals with no owner and no next step. The work stalls, but this is not immediately visible on the dashboard.
Tweaking the data for the sake of a nice report. The CRM stops reflecting reality, and control loses its meaning.
How to check the result
- the dashboard makes it clear how much money is in progress and what the conversion is;
- the attention filter shows no forgotten overdue deals without action;
- active deals have an owner and a next step;
- closed deals have an outcome and a reason;
- the metrics match the real state of the work, not the desired one.